


Carmageddon by the numbers
July 19, 2011
So how big an impact did the 405 closure have on Los Angeles last weekend? Big, if you believe the statistics that have been trickling in this week. Some numbers—such as the sales tax receipts that will reflect the closure’s economic impact—won’t be available for a while yet. But it’s not too soon to begin a preliminary tally.
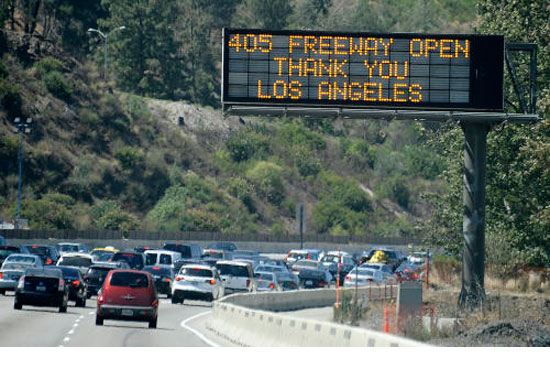
- Planned length of the closure: 53 hours. The actual length: 35 hours, 57 minutes on the southbound 405; 35 hours, 58 minutes on the northbound side.
- Amount of money Kiewit Infrastructure West could have been fined for finishing late on the demolition: $72,000 per hour. The bonus Kiewit got for finishing early: $300,000. Savings to the public in salary costs for the early finish (bonus included): $400,000.
- Approximate percentage of normal traffic Caltrans engineers expected would be diverted from the open stretches of the 405 during the closure: 20%. Actual amount: 64-65%.
- The number of vehicles on the northbound 405 at Culver on July 9, the Saturday before Carmageddon: 131,516. The number of vehicles on the northbound 405 at that same location on Carmageddon Saturday: 45,483.
- Estimated ridership increase on free Metro buses and subways: 15-20%.
- Travel time on the 101 Freeway from Laurel Canyon to Downtown L.A. on the Saturday before before the closure: 25 minutes. On Carmageddon Saturday: 12 minutes.
- Number of violent crimes reported to the Los Angeles County Sheriff’s Department and LAPD on Saturday, July 9: 276. On Carmageddon Saturday: 260.
- Number of traffic collisions handled by CHP countywide on July 9: 185. On Carmageddon Saturday: 136.
- Number of people arrested by CHP on Saturday for trying to walk or bicycle on the closed area of the 405: 8.
- Emergency room visits at Ronald Reagan UCLA Medical Center on Carmageddon Saturday: 94. Average daily number of emergency room visits at Ronald Reagan UCLA Medical Center: 121.
- Emergency room visits at Cedars-Sinai Medical Center on Carmageddon Saturday: 199. Average daily emergency room visits at Cedars-Sinai: 228.
- Number of 911 Fire/EMS calls to Los Angeles County and City Fire departments on July 9, the Saturday before Carmageddon: 2,037. Number of 911 Fire/EMS calls to Los Angeles County and City Fire departments on Carmageddon Saturday: 1,773.
- Ozone peak in Los Angeles County on Saturday, July 9, in parts per billion: 91. On Carmageddon Saturday 87.
- Attendance at Los Angeles County beaches on Saturday, July 9: 922,950. On Carmageddon Saturday: 544,850.
- Combined parking revenues from Will Rogers and Zuma beaches for the weekend before the 405 closure: $82,499. On Carmageddon weekend: $36,425—a drop of 55.8%.
- Expected turnout at the July 16 LA Galaxy-Real Madrid soccer game at the Los Angeles Memorial Coliseum: 60,000-100,000. Actual attendance: 56,211. Attendance at last year’s August match at the Rose Bowl between the same teams: 89,134.
- Some good news: Natural History Museum of Los Angeles County attendance on the Saturday before Carmageddon was 1,200. Attendance for the new Dinosaur Hall opening on Carmageddon Saturday: 3,785.
- Google search ranking for the term “Carmageddon” on July 15, the day before the closure: 3. Google search ranking on the same day for “Harry Potter reviews”: 5.
Sources: Los Angeles County Metropolitan Transportation Authority; Caltrans; Los Angeles County Sheriff’s Department; California Highway Patrol; Los Angeles County Dept. of Health Services Emergency Services Agency; South Coast Air Quality Management District; Los Angeles County Fire Department, Lifeguard Division; Los Angeles County Department of Beaches and Harbors; Los Angeles Coliseum; Will Rogers State Park; Natural History Museum of Los Angeles County; Los Angeles County Museum of Art; Google Trends


 405 bridge work causes a stink