


Do beach report cards make the grade?
June 14, 2012
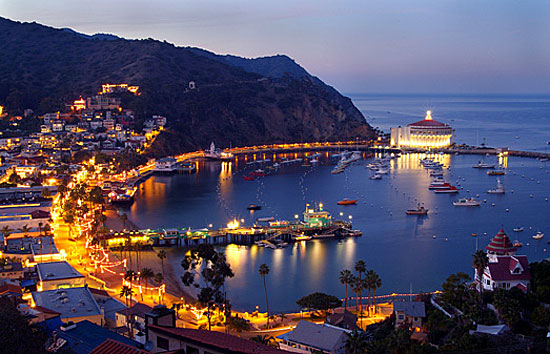
Avalon Beach on Catalina Island, where cleanup efforts have not led to improved water quality.
Summer is almost here, with news from the coastline: More than 80% of the county’s beaches are clean.
Or are they?
Beach report cards such as those generated by Heal the Bay and Los Angeles County raise public consciousness and spur crucial cleanup efforts. But what do they really mean?
Chad Nelsen, environmental director of the San Clemente-based Surfrider Foundation, says he views beach grades and report cards as a rough-but-useful guide to a beach’s overall cleanliness and history. Beach grades aren’t same-day evaluations, he notes, and they don’t yet say enough about why a beach’s bacteria level may be elevated.
“Any given beach can be clean on any given day, but these kinds of report cards look at the average,” says Nelsen. “They can tell you if a beach is chronically polluted or typically clean.”
Beach grades are culled from ocean water samples collected from hundreds of coastal locations. In Los Angeles County, the Department of Public Health samples the water weekly at 40 sites between the Ventura County line and the Redondo Beach Pier, plus five sites between April and October at Avalon Beach on Catalina Island.
In addition, the department reviews monitoring results from scores of samples taken by the Los Angeles Bureau of Sanitation, the Hyperion water treatment plant and the Los Angeles County Sanitation District.
Those samples are tested for total coliform, fecal coliform, and enterococcus bacteria—so-called “indicator” bacteria that signal the presence of agents that can make swimmers sick. The results are compared to state water quality standards and updated each week by the Department of Public Health. Then they are turned into a rolling 30-day online “report card” that grades the water quality at each beach from A to F.
The test results also are shared with Heal the Bay, a nonprofit environmental watchdog group that analyzes water quality at hundreds of beaches along the West Coast and posts its own weekly beach-by-beach assessment, as well as a comprehensive annual report published in May.
Surfrider’s Nelsen compares beach grades to “a spelling class, with a bunch of weekly quizzes.”
“You might get an A or a B or even an F on a given week, but if the scores average out to an A at the end of the month or the end of the year, you’re probably doing pretty well.”
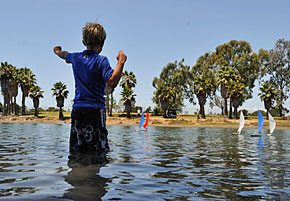
Long Beach's Colorado Lagoon aced its tests.
This year’s Heal the Bay report had mixed reviews for L.A. County: Some 82% of the county’s beaches had earned dry-weather grades of A or B last year, a 7-point improvement over the prior year. But the county was still below the statewide average, and trouble spots persisted in places like Avalon and Malibu.
The reasons for those scores tend to defy simplification.
Ken Murray, who directs the Department of Public Health’s Bureau of Environmental Protection, says the test results, and therefore the grades, are impacted by all sorts of factors—weather, water depth, whether the sample was taken near or far from the mouth of a storm drain, even the number of birds in the area.
Pollution control efforts inland can make a big difference. Malibu’s new Legacy Park, for example, is essentially a grassy, state-of-the-art system for capturing urban runoff. And Murray says a new rainwater harvesting system at Penmar Park in Venice “is really going to help the water quality in the beaches because runoff there is going to be captured and treated—and used to water the Penmar Park golf course—before it can hit the bay.”
Precipitation is also a major factor. A beach that is Grade A in dry weather can be rendered unfit overnight by a heavy rain and the ensuing runoff, and be perfectly swimmable again in less than a week as bad bacteria are dispersed by waves and killed by sunshine.
Long Beach, for instance, was a coastal success story this year, partly because of big projects upstream that diverted runoff, upgraded sewers and reduced the tons of debris that the Los Angeles River dumps out onto its beaches. But city officials noted that part of that sharp improvement—93 percent of the city’s beaches recorded A or B grades on the Heal the Bay scorecard—may also have simply stemmed from a relative lack of rain.
Avalon, meanwhile, has been a chronic low scorer and officials have spent years trying to pin down the reasons. “We had thought the problem was sewage lines around Avalon Harbor,” Murray says. “But they spent millions to repair that, and the bacteria levels are still high.”
More tests—these ones on boats—were similarly inconclusive. Now Avalon’s antiquated sewers are undergoing a new, multi-million-dollar round of repairs, and the city is under a cease-and-desist order from the state to clean up its water. Also, Murray says, a team of UC Irvine researchers is studying Avalon “to give us a new set of eyes.”
Amanda Griesbach, a Heal the Bay water quality scientist, says the science is evolving. Someday, she predicts, beachgoers will be able to tell the cleanliness of the water with a single, same-day dipstick test that will be posted at each beach and may even suggest a pollutant’s origin.
“When that happens—and that’s where the science is heading—it will be awesome,” says Griesbach. “But right now, the existing methods are the best we have.”
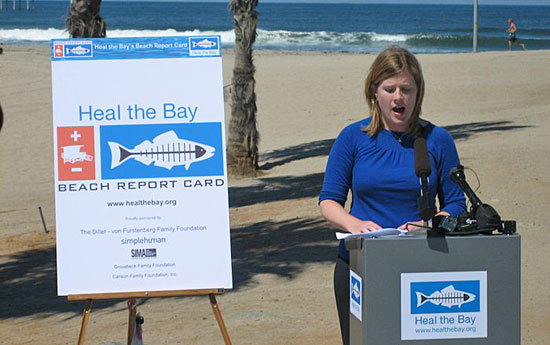
Heal the Bay grades water quality at hundreds of beaches along the West Coast.
Posted 6/14/12


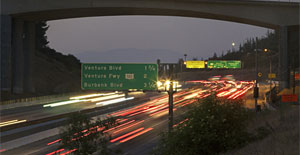
 405 bridge work causes a stink