Death by ZIP code
July 27, 2010
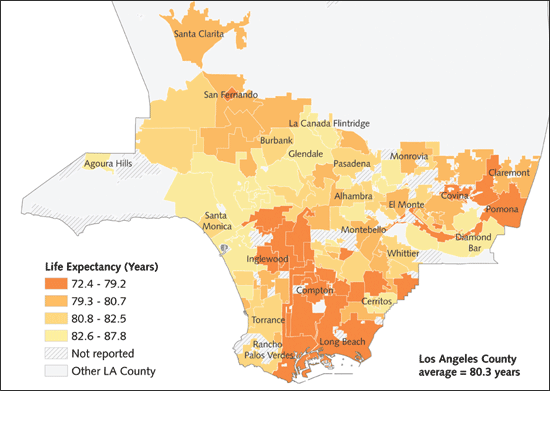
Nestled against the mountains, at the foot of Angeles Crest Highway, is La Canada Flintridge, one of the region’s wealthiest enclaves, a place where the residents not only prosper but live long.
According to a provocative new report by L.A. County’s Department of Public Health, La Canada Flintridge residents have an estimated life expectancy of 87.8 years—longer than anywhere else in the county.
Then there’s Westmont, a community in the challenging flatlands of South Los Angeles, where incomes are low, crime is high and drop out rates are through the roof. There, public health officials estimate that life expectancy is the worst in the county—72.4 years. Put another way, Westmont residents might live an average of 15 fewer years than the residents of La Canada Flintridge.
This stunning disparity is the central point of the Public Health Department’s most recent community-by-community exploration of how socio-economic factors are influencing our health and mortality.
“It’s a tall mountain to climb,” Public Health Director Dr. Jonathan Fielding said of the problems eroding life expectancy in dozens of communities. “But you climb a mountain one step at a time.”
Last month, the department released a detailed report on smoking rates throughout the county.
Its latest report—“Life Expectancy in Los Angeles County: How long do we live and why?”—ranks life expectancy in more than 100 local cities and communities with populations larger than 15,000. To bring deeper meaning to those numbers, the report also ranks these same places through an “economic hardship index,” a measure that includes such factors as poverty, unemployment, education and housing.
In an introduction to the report, Fielding called the results “sobering,” saying that they show “reduced life expectancy is strongly related to community-level economic conditions.”
“Poorer neighborhoods,” the report explains, “may have fewer large grocery stores, resulting in less access to fresh, nutritious and affordable fruits and vegetables, and may have fewer outdoor recreation areas and safe places where children and families can play.”
Fielding and his staff caution that the correlations between life expectancy and economic hardships are based on statistical assumptions, the availability of records and the size of the population pools. For example, the community of Lennox ranks among the highest in life expectancy but, conversely, ranks among the worst in social problems.
Beyond neighborhood rankings, the study also examines the widely varying life expectancy rates between races and genders, including this extreme example: an Asian/Pacific Islander female is expected to live 18 years longer than a black male (86.9 vs. 69.4).
Despite the troubling disparities between communities and individuals, Fielding noted that, in the bigger picture, the news is good because life expectancy has risen nearly five years since 1991. “That’s amazing,” he said. “We’ve made enormous progress.” The countywide average is now 80.3 years, according to the report
At its heart, the life expectancy study is a call to action by the Public Health Department. It recommends a number of strategies to begin closing the longevity gap, ranging from providing more recreational opportunities, to fostering more social connections, to increasing public safety and limiting access to alcohol and drugs.
Here’s a list of the Top 10 communities with the longest and shortest life expectancy. To see how your community ranks, click here.
Posted 7/27/10


 405 bridge work causes a stink
